| Water Year | CVP Allocation % | Net CVP (AF) | Groundwater (AF) | Water User Acquired (AF) | Additional District Supply (AF) | Total Supply (AF) | Fallowed Acres |
|---|---|---|---|---|---|---|---|
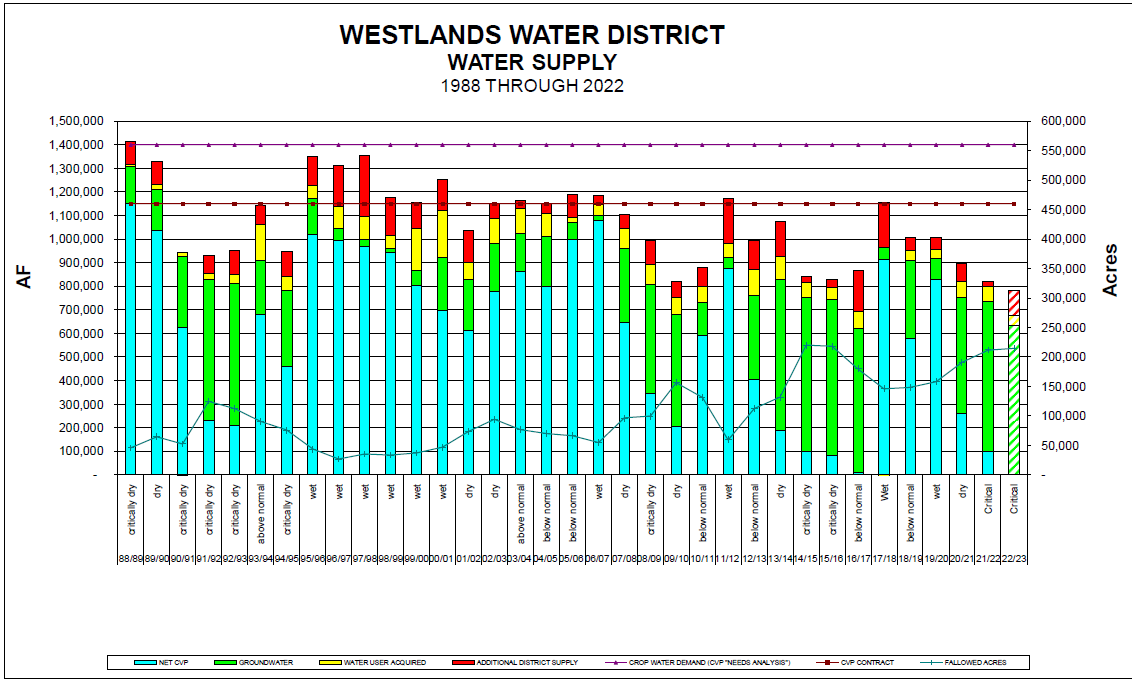
| 1988 | 100% | 1,150,000 | 160,000 | 7,657 | 97,712 | 1,415,369 | 45,632 |
| 1989 | 100% | 1,035,369 | 175,000 | 20,530 | 99,549 | 1,330,448 | 64,579 |
| 1990 | 50% | 625,196 | 300,000 | 18,502 | (2,223) | 941,475 | 52,544 |
| 1991 | 27% | 229,666 | 600,000 | 22,943 | 77,399 | 930,008 | 125,082 |
| 1992 | 27% | 208,668 | 600,000 | 42,623 | 100,861 | 952,152 | 112,718 |
| 1993 | 54% | 682,833 | 225,000 | 152,520 | 82,511 | 1,142,864 | 90,413 |
| 1994 | 43% | 458,281 | 325,000 | 56,541 | 108,083 | 947,905 | 75,732 |
| 1995 | 100% | 1,021,719 | 150,000 | 57,840 | 121,747 | 1,351,306 | 43,528 |
| 1996 | 95% | 994,935 | 50,000 | 92,953 | 172,609 | 1,310,497 | 26,754 |
| 1997 | 90% | 968,408 | 30,000 | 94,908 | 261,085 | 1,354,401 | 35,554 |
| 1998 | 100% | 945,115 | 15,000 | 54,205 | 162,684 | 1,177,004 | 33,481 |
| 1999 | 70% | 806,040 | 60,000 | 178,632 | 111,144 | 1,155,816 | 37,206 |
| 2000 | 65% | 695,693 | 225,000 | 198,294 | 133,314 | 1,252,301 | 46,748 |
| 2001 | 49% | 611,267 | 215,000 | 75,592 | 135,039 | 1,036,898 | 73,802 |
| 2002 | 70% | 776,526 | 205,000 | 106,043 | 64,040 | 1,151,609 | 94,557 |
| 2003 | 75% | 863,150 | 160,000 | 107,958 | 32,518 | 1,163,626 | 76,654 |
| 2004 | 70% | 800,704 | 210,000 | 96,872 | 44,407 | 1,151,983 | 70,367 |
| 2005 | 85% | 996,147 | 75,000 | 20,776 | 98,347 | 1,190,270 | 66,804 |
| 2006 | 100% | 1,076,461 | 25,000 | 45,936 | 38,079 | 1,185,476 | 54,944 |
| 2007 | 50% | 647,864 | 310,000 | 87,554 | 61,466 | 1,106,884 | 96,409 |
| 2008 | 40% | 347,222 | 460,000 | 85,421 | 102,862 | 995,505 | 99,663 |
| 2009 | 10% | 202,991 | 480,000 | 68,070 | 70,149 | 821,210 | 156,239 |
| 2010 | 45% | 590,059 | 140,000 | 71,296 | 79,242 | 880,597 | 131,339 |
| 2011 | 80% | 876,910 | 45,000 | 60,380 | 191,686 | 1,173,976 | 59,514 |
| 2012 | 40% | 405,451 | 355,000 | 111,154 | 123,636 | 995,241 | 112,755 |
| 2013 | 20% | 188,448 | 638,000 | 101,413 | 143,962 | 1,071,823 | 131,848 |
| 2014 | 0% | 98,573 | 655,000 | 59,714 | 26,382 | 839,669 | 220,053 |
| 2015 | 0% | 82,429 | 660,000 | 51,134 | 34,600 | 828,163 | 218,112 |
| 2016 | 5% | 9,204 | 612,000 | 72,154 | 174,374 | 867,732 | 179,784 |
| 2017 | 100% | 911,307 | 54,000 | (50,009) | 174,490 | 1,089,788 | 146,275 |
| 2018 | 50% | 580,050 | 328,000 | 42,338 | 55,872 | 1,006,260 | 148,320 |
| 2019 | 75% | 827,317 | 89,000 | 37,985 | 53,433 | 1,007,735 | 158,103 |
| 2020 | 20% | 259,540 | 493,000 | 66,436 | 78,780 | 897,756 | 190,972 |
| 2021 | 0% | 99,928 | 636,000 | 63,822 | 20,595 | 820,345 | 211,920 |
| 2022* | 0% | 4,000 | 630,000 | 42,000 | 105,000 | 781,000 | 214,500 |
*Estimated
Definitions:
Water Year – March 1 to February 28 (29 Leap Year)
Final CVP Allocation ( 100% = 1,150,000 AF)+(Reassignment = 45,383 AF**)
Net CVP – CVP Allocation adjusted for carry over and rescheduled losses
Groundwater – Total groundwater pumped
Water User Acquired – Private Landowner water transfers
Additional District Supply – Surplus water, supplemental supplies, and other adjustments.
Fallowed Acres – Agricultural land out of production